The Major Spending Categories Every Homeowner Needs to Track
Most household budgets collapse into five core categories: housing, food, transportation, healthcare, and personal/discretionary spending. For homeowners, the housing category alone is more complex than it looks - it includes your mortgage principal and interest, property taxes, homeowners insurance, HOA fees if applicable, and routine maintenance. Lumping these together as one number hides where the real pressure points are.
Here's a practical breakdown of how a typical US household's spending distributes across categories, based on data from the Bureau of Labor Statistics Consumer Expenditure Survey:
- Housing: Roughly 33% of total spending - the single largest category for most households
- Transportation: Around 16%, including car payments, fuel, insurance, and maintenance
- Food: About 13%, split between groceries and dining out
- Healthcare: Approximately 8%, rising significantly for older households
- Personal and discretionary: The remainder, covering entertainment, clothing, subscriptions, and savings
The key insight here isn't the exact percentages - those vary by income level, location, and household size - but that housing and transportation together consume roughly half of most budgets before anything else gets paid. That's the starting constraint your budget has to work around.
33%
Average share of spending on housing
According to the Bureau of Labor Statistics Consumer Expenditure Survey, housing is the largest single expense category for US households.
1%
Annual home maintenance rule of thumb
Many financial planners recommend setting aside roughly 1% of a home's purchase price each year to cover maintenance and repair costs.
~49%
Housing and transportation combined
BLS Consumer Expenditure data consistently shows these two categories alone account for nearly half of average US household spending.
Why Your Budget Estimates Are Probably Off
Most people significantly underestimate what they spend, particularly in categories with variable or infrequent costs. Groceries and dining out tend to be underestimated by 20-30% when recalled from memory rather than tracked from statements. Homeowners face an additional challenge: costs like pest control, appliance repairs, gutter cleaning, and annual insurance premiums don't show up every month, so they get mentally excluded from the budget - until they hit.
The fix is straightforward but requires honesty: pull three months of actual bank and credit card statements, categorise every transaction, and calculate a true monthly average. Annual costs like property taxes or HOA dues should be divided by 12 and treated as a monthly expense. This process typically surfaces two or three categories where spending is running noticeably higher than assumed.
Start With Actual Numbers, Not Estimates
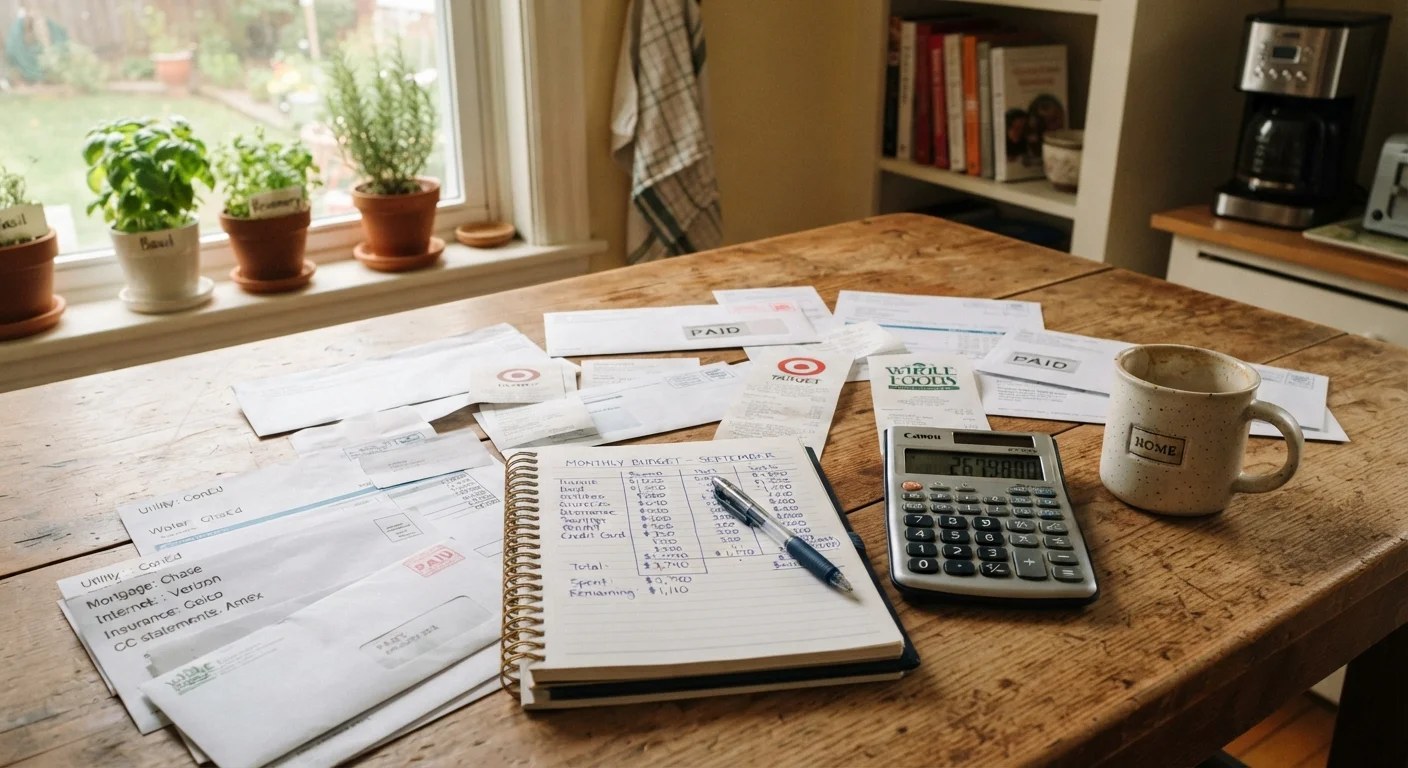
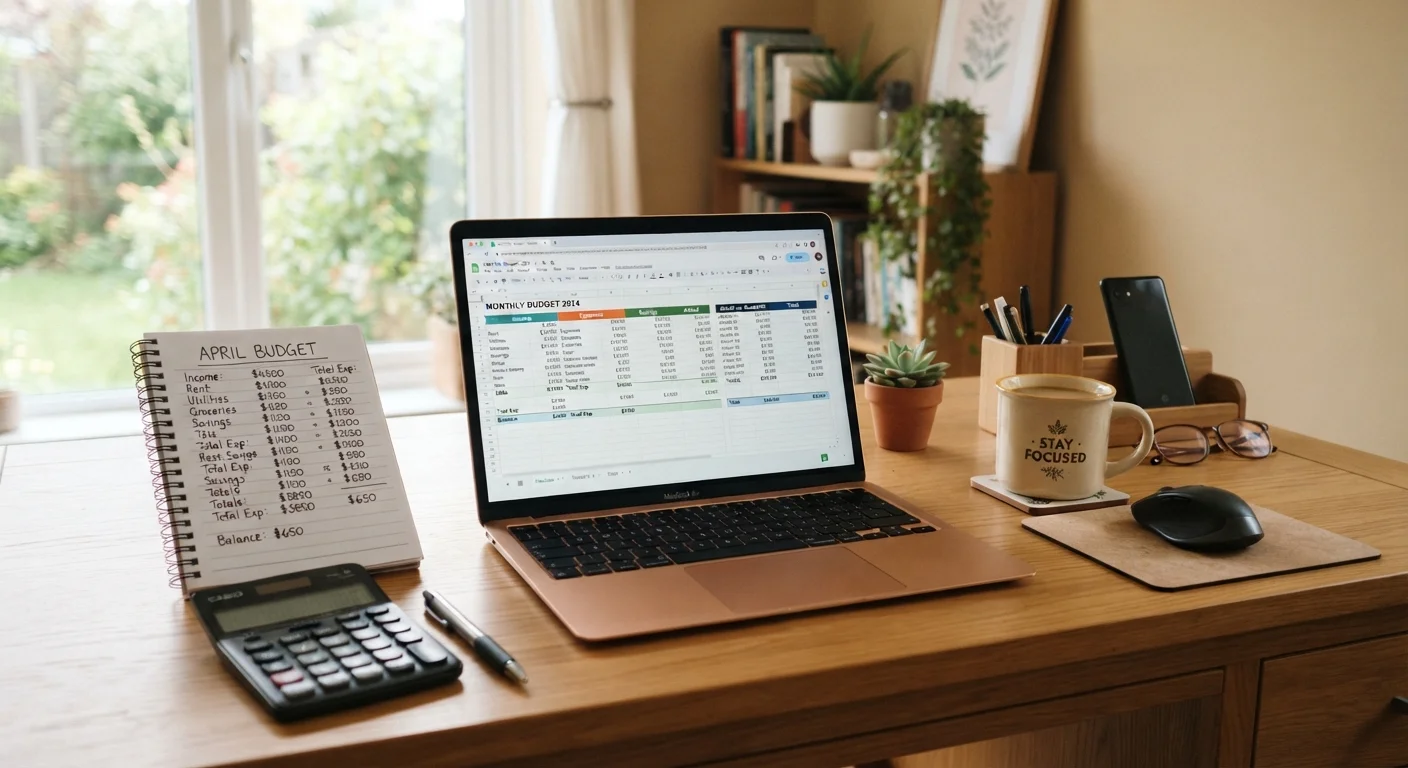
Before building any budget framework, spend 30 days tracking every dollar you actually spend - not what you think you spend. Use your bank's transaction export or a spreadsheet to categorise purchases. This single step typically reveals two to three categories running 20-40% higher than expected, and gives you a realistic baseline to budget from rather than an optimistic fiction.
For a structured approach to this process, the step-by-step home budget guide walks through categorising income and expenses from scratch, including how to handle irregular costs.
Applying a Framework: The 50/30/20 Rule for Homeowners
The 50/30/20 rule - 50% of net income to needs, 30% to wants, 20% to savings and debt repayment - is a reasonable starting framework, but homeowners in mid-to-high cost markets often find it requires modification. A mortgage alone can consume 25-30% of net income, leaving little room within the 50% bucket for utilities, insurance, groceries, and transportation.
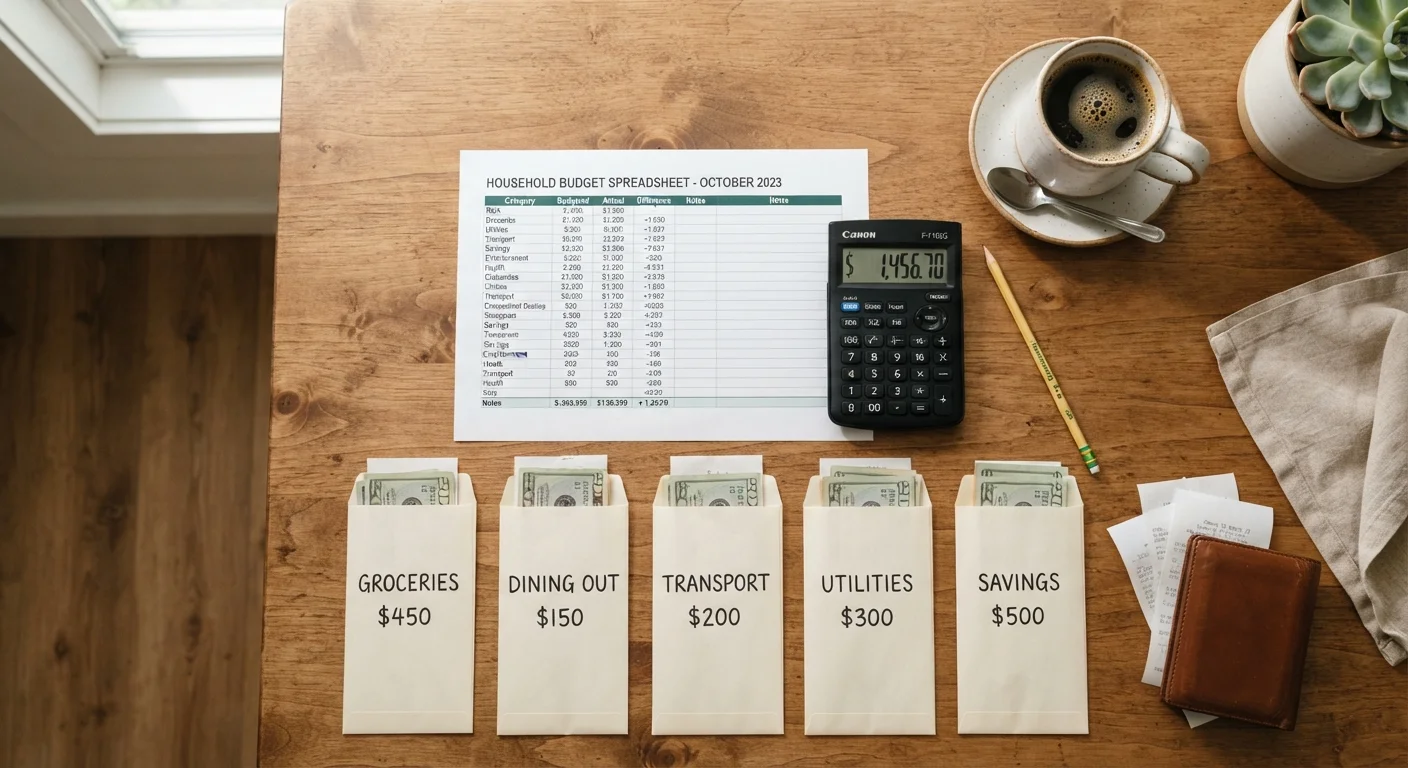
A more practical approach for homeowners is to calculate your actual fixed obligations first - mortgage, insurance, utilities, car payment, minimum debt payments - and see what percentage of net income they represent. If fixed costs exceed 55-60%, the discretionary and savings portions need to compress accordingly, which means being deliberate rather than aspirational about the 20% savings target.
Unfamiliar with terms like debt-to-income ratio or discretionary spending? The household budget glossary defines the key concepts in plain language with homeowner-specific context.
Building a Budget That Holds Up Over Time
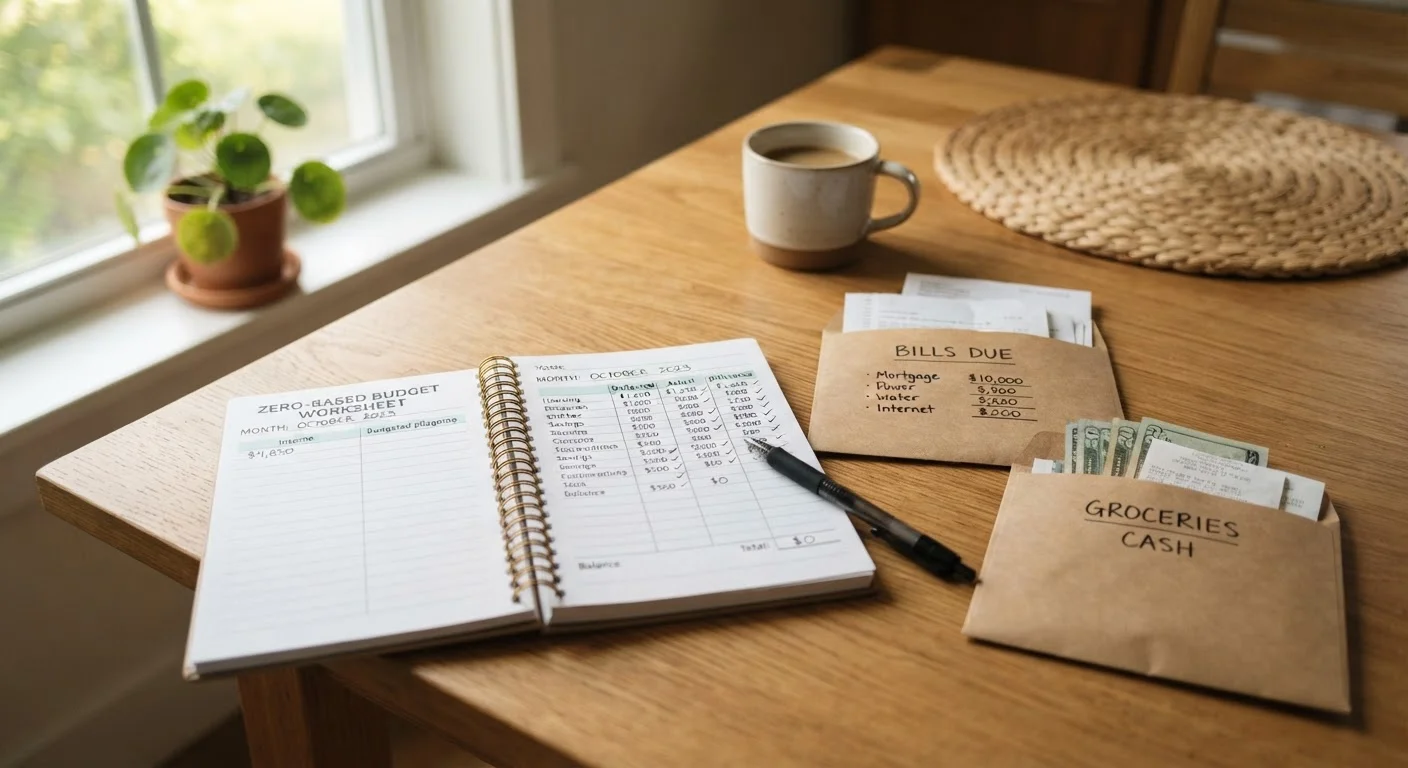
A budget that works on paper in January needs to survive February's heating bill, March's tax payment, and April's emergency plumbing call. The households that maintain working budgets share a few habits: they treat savings as a fixed expense rather than an afterthought, they build a buffer category for unexpected costs, and they review the budget monthly rather than annually.
For homeowners specifically, the hidden costs of homeownership are a common budget-buster - costs that were never planned for because they weren't visible at purchase. Folding these into your baseline from the start is what separates a durable budget from one that gets abandoned after the first surprise.
If recurring utility and insurance bills are consuming more of your budget than expected, the saving on bills hub covers practical ways homeowners can reduce those fixed monthly obligations without sacrificing coverage or comfort.
This article provides general financial information for educational purposes and does not constitute personalised financial advice. Consult a qualified financial professional for guidance tailored to your specific circumstances.