Why the First Year Hits Hardest
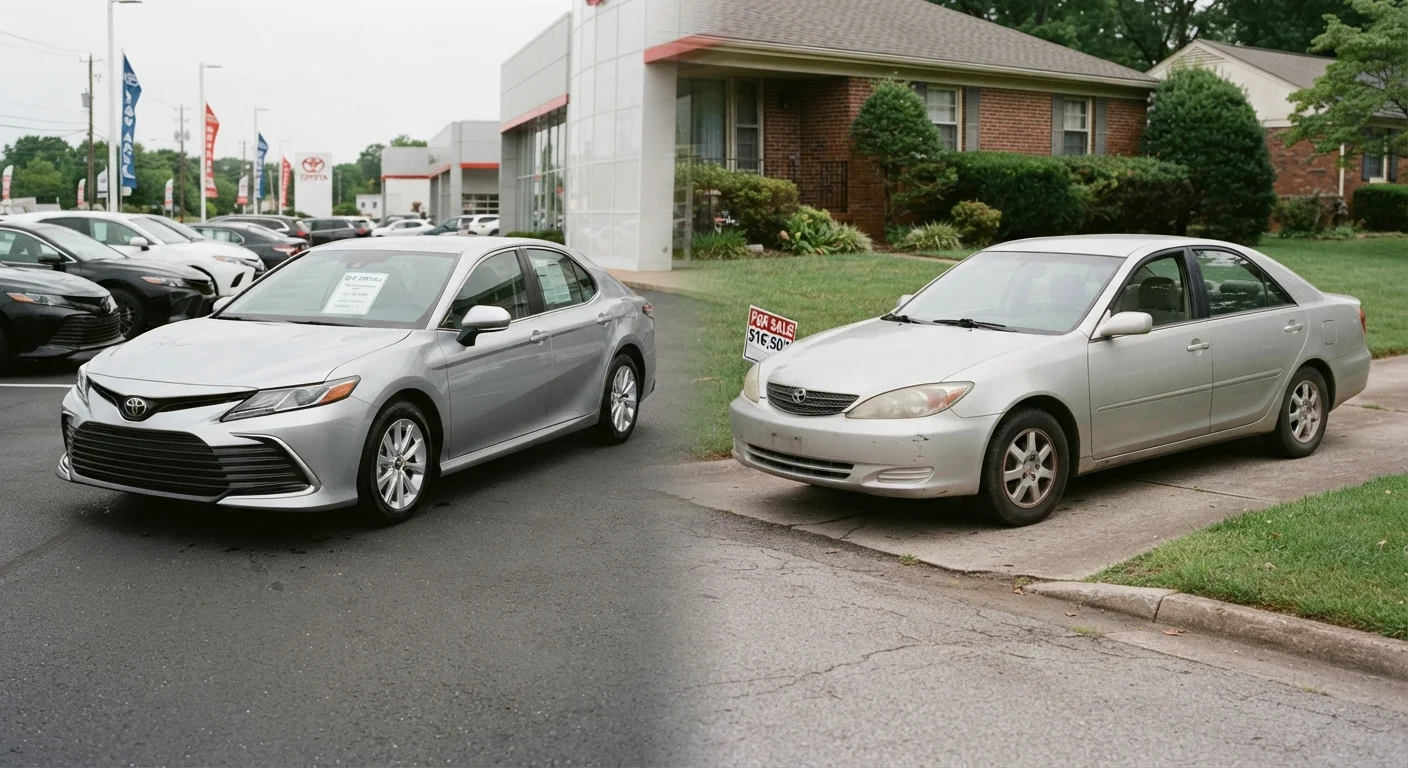
The steepest depreciation drop happens in year one - typically between 15% and 25% of the purchase price, depending on the vehicle. This is not about wear and tear. It is purely a market dynamic: once a car is registered, it is classified as used, and used cars command lower prices because buyers factor in unknown history and potential repair risk.
By the end of year three, many vehicles have lost 40-50% of their original value. The rate then tends to flatten. This is why the depreciation curve matters to anyone making a purchase decision: the buyer of a new car absorbs the sharpest losses, while the buyer of a two- or three-year-old vehicle steps in at a much gentler slope.
15-25%
Value lost in the first year of ownership
Industry cost-of-ownership analyses consistently show new vehicles lose this share of their purchase price within 12 months of registration.
~50%
Value lost by year five for many new vehicles
Averaged across common vehicle segments in the US market, roughly half of a new car's purchase price is lost within five years of ownership.
40-50%
Share of total ownership costs from depreciation
Multiple independent cost-of-ownership studies show depreciation typically represents the single largest ownership expense over a five-year period.
The Factors That Accelerate or Slow Value Loss
Depreciation is not uniform across all vehicles. Several factors shape how quickly a car loses value:
- Mileage: Higher-than-average annual mileage accelerates depreciation. Most valuation models assume roughly 12,000-15,000 miles per year; exceeding this benchmark reduces resale value more quickly.
- Brand reliability perception: Vehicles from manufacturers with strong long-term reliability reputations in the US market tend to hold value better. Consumer trust translates directly into resale demand.
- Color and trim: Neutral colors - white, black, silver, grey - typically have broader buyer appeal and depreciate more slowly than unusual colors. Higher trim levels with desirable features can also support residual value.
- Fuel type and market shifts: Shifts in fuel prices or government incentive structures can change which powertrains hold value. Hybrid and electric vehicles have shown variable depreciation patterns as the market matures.
- Condition and service records: A documented maintenance history signals to buyers that the vehicle was cared for, which supports resale price.
Depreciation as a Real Budget Line Item
Most drivers budget for fuel, insurance, and loan payments. Few explicitly budget for depreciation - yet it is consistently one of the largest costs of vehicle ownership over a five-year period. Industry cost-of-ownership analyses routinely show that depreciation can represent 40-50% of total ownership costs for a new vehicle.
The practical implication: when comparing the cost of owning a vehicle, the purchase price alone is incomplete information. A car bought for $35,000 that loses $12,000 in value over three years has an effective depreciation cost of $333 per month - before factoring in any other expense.
“Depreciation is the silent cost that most car buyers never see on an invoice - but it shows up clearly when they try to sell.”
— Car Ownership Tips Editorial Team, Automotive cost-of-ownership researchers
Understanding this helps homeowners make more accurate comparisons between buying new, buying used, or leasing - each of which shifts who bears the depreciation burden and how it shows up in monthly cash flow.
This article is for general informational purposes only and does not constitute financial or investment advice. Consult a qualified financial professional for guidance specific to your situation.